


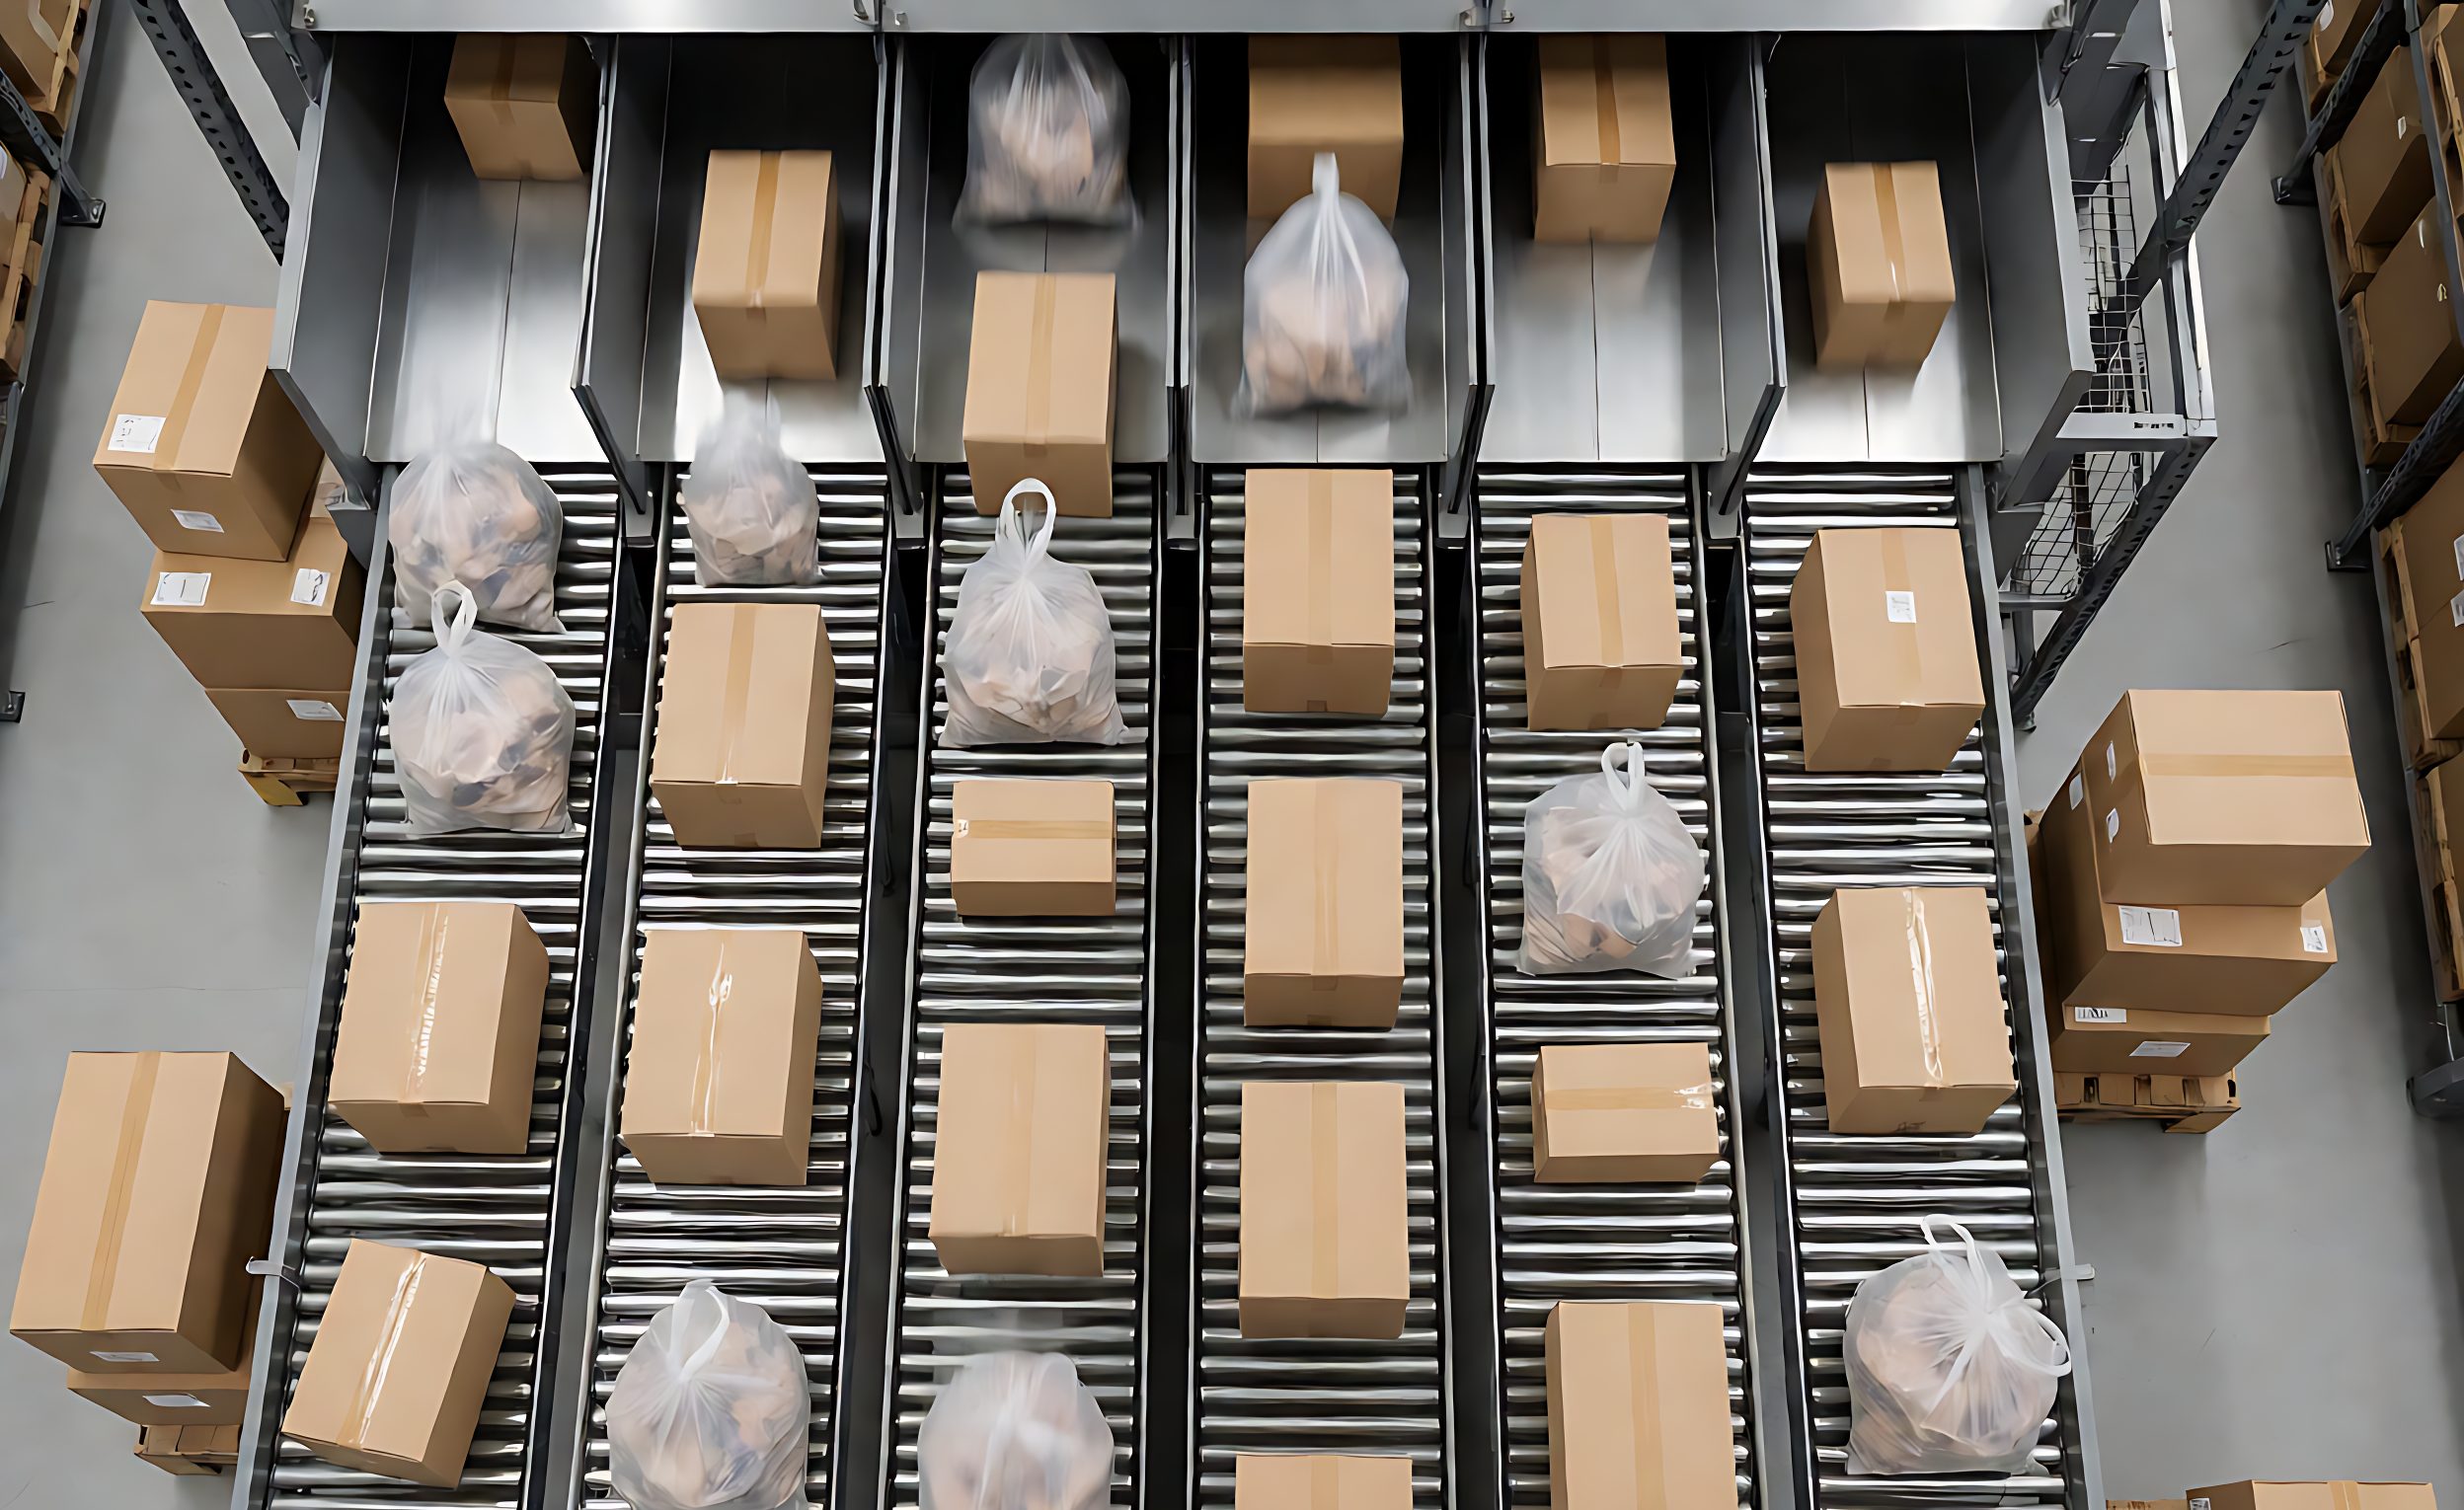
A parcel that cannot discharge does not disappear. It takes another lap, occupying carrier space, consuming energy and delaying everything behind it. Individually a recirculated parcel costs seconds; collectively, recirculation is one of the largest and least discussed losses in sortation capacity.
The recirculation ratio – the share of inducted parcels that complete more than one lap – deserves to be specified, measured, and treated as a defect above a threshold. This article explains where it comes from, why it compounds, and how to bring it into capacity planning honestly.
Defining the Number Precisely
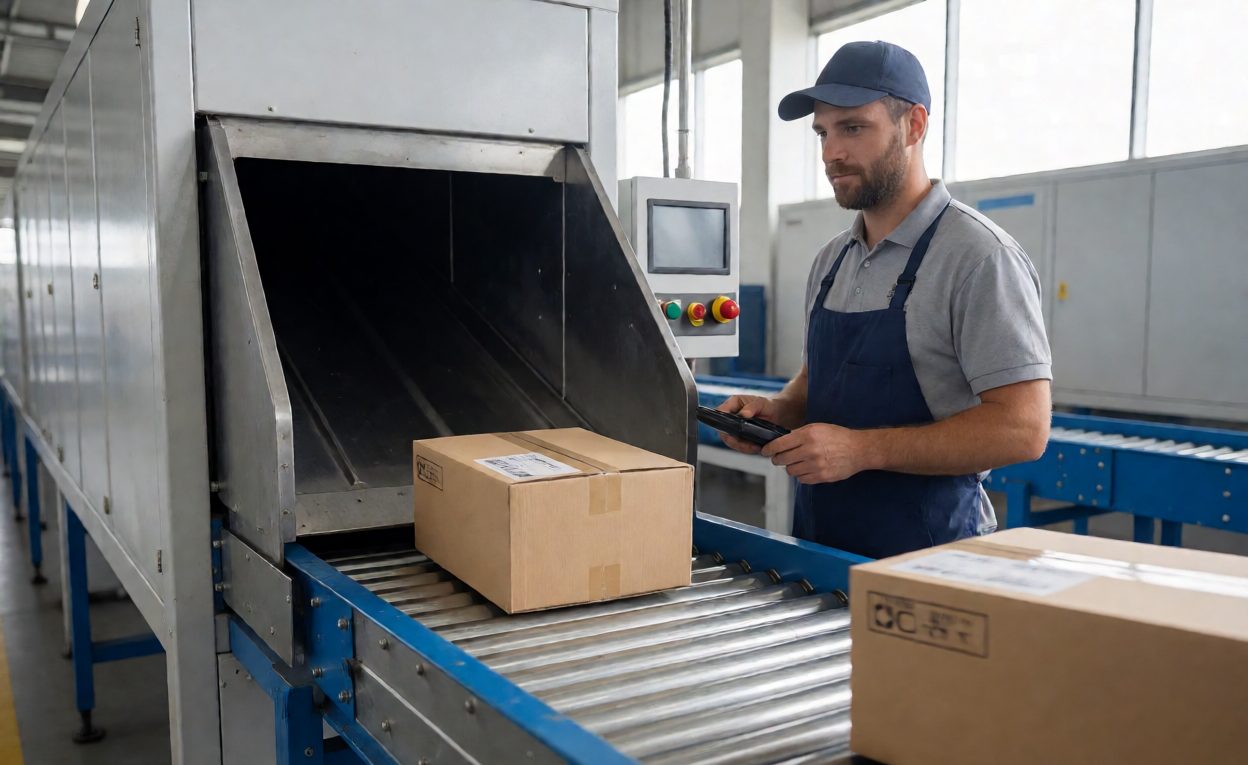
Two definitions are in circulation and they produce very different figures. The first counts passages: every parcel that goes round more than once in the numerator, regardless of how many extra laps it makes. The second counts additional laps – the total extra lap distance divided by the parcels inducted. A five percent parcel-level ratio can easily be a twelve percent lap-level loss if some parcels circle several times.
Decide which one you mean before accepting any number, because it changes the design conclusion. The lap-based measure is the useful one for capacity: it tells you how much carrying capacity is spent moving parcels that failed to leave.
Where Recirculation Comes From
Six causes account for nearly all of it, and they need different fixes:
- Full or blocked chutes, the largest source in real operations, when a container is not cleared in time.
- Closed destinations, because that lane has already departed or is not active in this wave.
- No-read and exception parcels, needing another attempt or a reject route.
- Failed discharge verification, where the parcel is retained rather than risked.
- Induced overload, feeding faster than the discharge points can absorb.
The critical observation is that takeaway discipline controls most of it. Recirculation is frequently a container management problem wearing an engineering costume.

Why the Loss Compounds
Recirculation does not subtract from throughput linearly. A recirculated parcel consumes carrier capacity on the second lap, and that carrier capacity is exactly the resource the waiting incoming parcels needed. As occupancy climbs, the probability that a parcel finds its target chute momentarily unavailable also climbs, because operators cannot clear containers quickly enough either. More recirculation therefore produces more recirculation, until the line settles at a stable but much lower effective rate.
This is why the symptom is not visible build-up but a quietly reduced ceiling. A line rated at twelve thousand parcels per hour carrying a sustained twelve percent recirculation delivers well under eleven thousand useful sorts, and the gap widens during peak. Modelling that gap is examined in how to verify CPH claims.
Sizing a Target Ratio
A target depends on the sort scheme rather than the machine. Single-lap operations with generous takeaway and mature container handling run in the low single digits; operations handling unresolved no-reads on the loop or squeezing container changeover see several times that. State an expected ratio for a defined parcel mix and test against it.
Two design levers move the figure. The first is handling exceptions off the loop: no-reads and manual keying need a reject route with its own capacity instead of competing with live parcels, the subject of rejection loop and no-read handling design. The second is a dedicated return path sized so second-lap parcels rejoin induction without disturbing first-lap flow.
Measuring It and Writing It Down
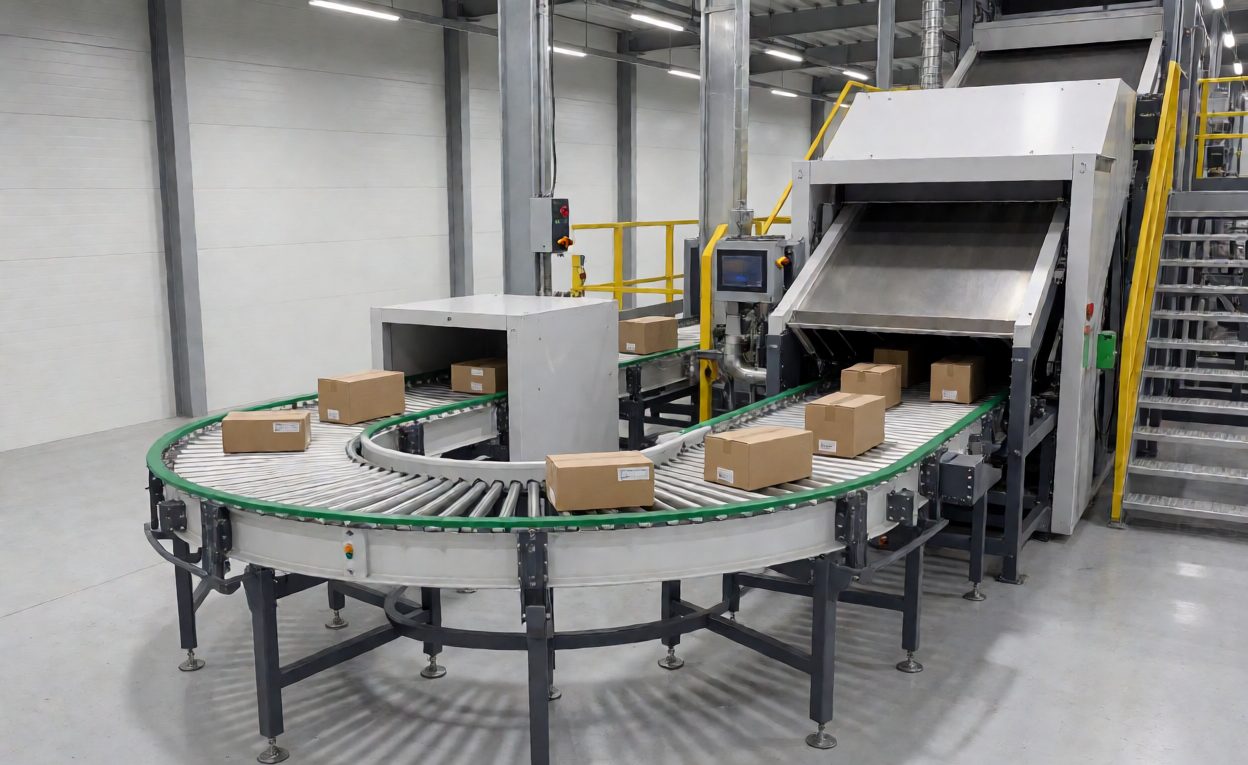
Measurement is straightforward if the control system is asked for it: parcels inducted, additional laps, and reason codes broken out by category. Reason codes turn a number into a fixable problem; without them, a rising ratio stays a mystery until someone watches the line for a shift.
Then put it in the acceptance test. Define the test parcels mix, the duration, the chute clearing resources that will be present, and the permissible additional-lap percentage, and measure it during FAT and SAT acceptance testing rather than discovering it under live volume. Data obligations of this kind belong in the operating data contract clauses, and upstream work reduces the load in parallel: raising read rates through no-read and missort reduction removes a meaningful slice of second laps before the loop is involved at all.
Capacity Planning With Recirculation Included
The planning correction is simple and rarely applied: size induction, loop capacity and takeaway against inflated demand. If the accepted additional-lap figure is eight percent, the loop must carry eight percent more package-passes than the parcels you ship. Most “the machine does not achieve rate” disputes are the arithmetic of recirculation applied to a line sized for parcels, not laps.
Induction is the other side, because operators see recycled parcels arriving from the return line and the feeding plan must account for that mixed flow – see induction station design and labour planning. Peak changes the ratio before it changes the machine: as volumes rise, container rounds tighten and recirculation climbs, so peak expansion planning must include takeaway labour, not only equipment.
Technical Background
Behaviour here is queueing rather than mechanics. Queueing theory explains why delay rises non-linearly as a system approaches capacity, and why a loop carrying its own failures behaves like a queue feeding itself. Effective throughput is counted at successful discharge rather than at launch, which is the distinction recirculation exploits. The relation between work in progress, completion rate and time in system is stated by Little’s law, the reason every extra lap lengthens the time each parcel occupies the loop.
Frequently Asked Questions
What is a normal recirculation ratio?
Single-lap operations with disciplined takeaway often run in the low single digits as additional laps; shared chutes, unresolved no-reads and tight container rounds push it considerably higher.
Should the ratio count parcels or laps?
Count additional laps for capacity purposes. It measures loop capacity consumed, which is what actually constrains throughput.
Why does recirculation rise during peak?
Container rounds tighten as volume grows, so chutes block more often, which creates more second laps while induction is simultaneously feeding faster.
Does a recirculation line solve it?
A dedicated return path prevents second-lap parcels from disturbing first-lap flow, but the root causes – full chutes and unresolved exceptions – still have to be managed.
Can recirculation be tested before acceptance?
Yes, and it should be, using a defined parcel mix, duration and chute clearing resource with a stated additional-lap threshold.
Is recirculation a hardware or an operations problem?
Mostly operations. Container clearing discipline and exception routing control the majority of second laps in real facilities.
How does it affect the number rated by the vendor?
Rated capacity usually assumes clean single-pass flow. Size induction and loop capacity for parcels plus accepted additional laps rather than for shipped parcels alone.