


The January returns wave is one of the more predictable capacity problems in e-commerce logistics — and one of the least prepared for. Unlike a demand spike, it has a fixed start date: the day after Christmas. For operators planning the 2026 peak, Black Friday falls on November 27 and the returns surge begins around December 26, which leaves roughly 90 days from today to plan, spec, and commission returns processing automation before the wave arrives. This guide covers the numbers that justify the investment, the technology options by scenario, and a week-by-week plan sized to that window.
About TrueLiSort: TrueLiSort, a brand of Zhejiang Xinli Electrical Equipment Co., Ltd., builds automated sorting systems for e-commerce warehouses, 3PLs, and parcel hubs. The returns flow is a regular part of those projects, so the figures below are drawn from the engineering assumptions we use when quoting a returns line — not from a marketing brochure.
January Is a “Second Peak”: Why Returns Spike After the Holidays
The week after Christmas behaves like a second peak, not a footnote. DC Velocity has described the January flood of returns as its own seasonal surge for retailers and the warehouses that serve them: the goods that shipped in November and December come back in a compressed window starting around December 26. Carriers, 3PLs, and returns hubs feel the same pressure at the same time.
The trend underneath it is larger than one season:
- Volume keeps growing. Global e-commerce sales are projected to rise from roughly $6.5 trillion in 2025 to about $8.9 trillion by 2027 (industry market forecasts; treat as planning figures). More shipped volume means more returns in absolute terms, even at a flat return rate.
- Category return rates are not uniform. Appriss Retail and NRF data show online return rates that vary sharply by category; as planning baselines for sizing your line:
| Category | Online return rate (planning baseline) | What drives it |
|---|---|---|
| Apparel | 30–50% | Highest of any category; fit issues and bracketing |
| Footwear | 20–35% | Size fit; often bracketed with apparel |
| Electronics | 20–35% | Lower volume, high unit value; each return is expensive to process |
| Health & beauty | Under 8% | Low returns; rarely a driver of returns-line sizing |
- The peak is concentrated. Post-holiday daily volume in the returns window can run several times your normal level; 3–5x the March baseline is a reasonable planning multiple for e-commerce-heavy operations, and the true number depends on your channel mix. If apparel is a large share of your business, stress-test upward.
The operational point: if your returns line runs at 70% utilization in a normal week, it will overflow in January. The overflow is where the cost lives — overtime, temporary labor, and items that sit too long to resell at full price.
The Hidden Cost of Manual Returns Processing
Manual returns processing is labor-intensive by construction. Each item must be received, inspected, dispositioned (restock, refurbish, vendor-return, liquidate, or scrap), and routed — often several times across a facility. The cost shows up in four places.
Labor dominates the cost stack
Labor accounts for roughly 55–70% of returns-processing operating cost — treat this as a planning assumption based on operating budgets we review with customers, not a published statistic. US warehouse labor costs have risen roughly 18% between 2021 and 2025 (planning estimate drawn from published wage surveys), so the labor share of returns processing is a growing line item, not a fixed one.
The restock clock is a revenue clock
The longer an item sits in the returns area, the less it is worth. A common industry benchmark: items restocked within 24 hours retain materially more resale value than items that take 7–10 days to work through a manual line, because seasonal demand — apparel in early January above all — decays quickly. Treat this as a planning assumption and test it on your own SKUs; the direction of the effect is not in dispute.
Secondary costs you may be missing
Beyond direct labor, manual returns lines carry space cost (returns areas expand into storage), temporary-worker cost during the peak, error-correction cost when items are misrouted, and customer-service cost from slow refund processing. These rarely appear in a single budget line, which is why the payback of automation is usually understated in back-of-envelope math.
For the cost structure behind a sorting line, see our automated parcel sorting system cost guide. We deliberately do not publish a single “returns line price” here, because the configuration depends on volume, floor plan, and label quality.
Where Automation Wins in the Returns Flow
Returns processing automation is not one task; it is four, and automation helps each differently.
Receiving and triage / disposition
The first decision is where the item goes: restock, refurbish, vendor-return, liquidate, or scrap. A returns line typically starts with a DWS (dimensioning-weighing-scanning) station that captures dimensions, weight, and barcode in one pass, then routes the item to the lane that matches your disposition rules. This removes the walk-the-box-around-the-building step that dominates manual receiving, and it gives your WMS a timestamped record the moment the item enters the building.
Sorting
Once disposition is decided, volume separates the technologies. A swivel wheel sorter (or pop-up wheel sorter) is a compact, low-maintenance option for mid-volume returns; a narrow belt sorter fits tighter floor plans at moderate throughput; a cross belt sorter handles the high parcels-per-hour volumes typical of regional returns hubs. Sorting accuracy — parcels delivered to the correct lane — is the core KPI; modern sorters run well above 99% on configured layouts, a planning figure you should verify against your own label quality and slot configuration.
Quality decisioning with AI vision
The most error-prone step in returns is reading the label. Damaged thermal labels, faded barcodes, and handwritten return slips stall a manual line because someone must retype the data. AI vision plus OCR changes the math: on a configured DWS/OCR station, no-read rates drop from a few percent to below 0.1% (TrueLiSort planning estimate), and the exceptions that remain are flagged to an operator rather than silently misrouted.
Restock
The last step is getting the item back to a sellable position. Automation’s contribution is velocity: the same DWS data that routed the item can update inventory status in your WMS in near real time, so the item is sellable minutes after it crosses the scale — not days later after a paper record is keyed in.
Choosing the Right Returns Sorting Technology
There is no single “best” returns sorter; there is a configuration that fits your volume, floor plan, and mix. Three inputs decide the configuration: peak parcel volume (not annual average), the available floor plan, and the label quality of your return stream. As a rough sizing guide: below a few hundred returned items per day, a put wall with a DWS station is usually the right starting point; from several hundred to a few thousand, a narrow belt or swivel wheel sorter; above that, and for regional hubs, a cross belt.
- Put wall — the low-volume or startup option. Items are sorted by hand into a wall of slots while staff do visual quality checks. Capital cost is low and human judgment stays in the loop, but throughput is capped by labor and the line does not scale into a peak by itself.
- Narrow belt sorter — for mid-volume operations with limited floor space. A compact footprint, moderate parcels-per-hour, and a practical fit where a cross belt cannot physically fit.
- Cross belt sorter — the high-throughput choice for regional returns hubs and large 3PLs. Thousands of parcels per hour, gentle handling for mixed cartons and soft goods, and the configuration most likely to absorb a 3–5x January spike.
- DWS + AI OCR — the front end of an automated returns line. Captures dimensions, weight, and barcode in one pass, and reads damaged or handwritten labels that would otherwise stall the line.
For a direct technology comparison of cross belt vs narrow belt, see our dedicated comparison guide; here the point is selecting by scenario, not arguing one machine against another.
Manual vs Automated Returns Sorting
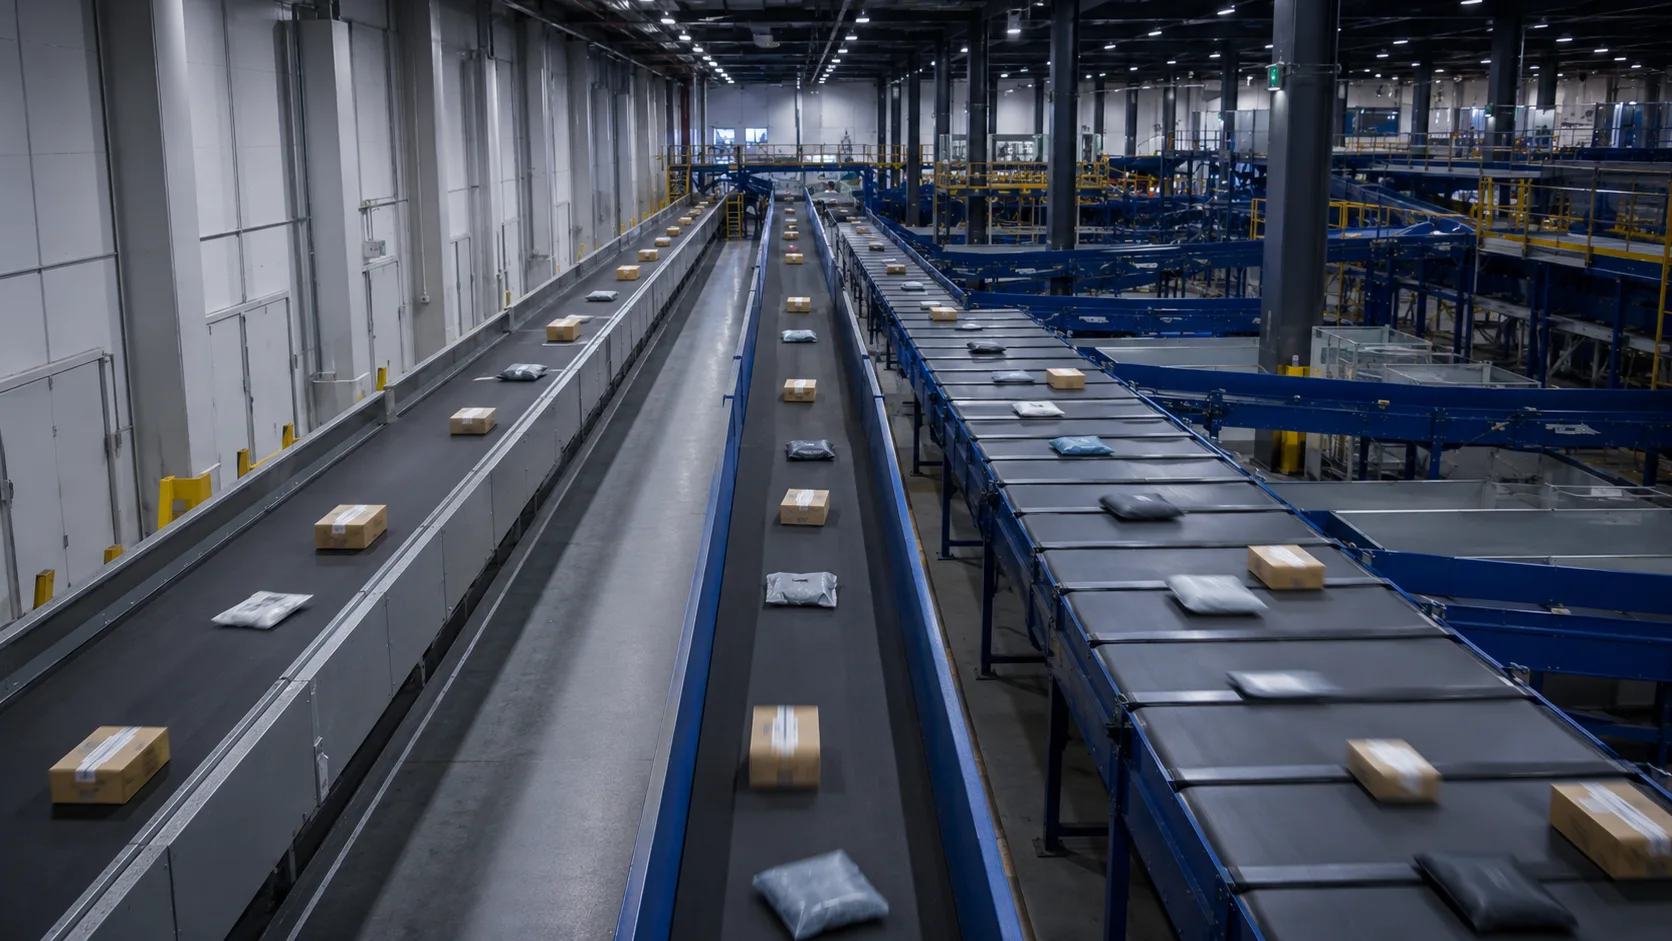
| Metric | Manual line | Automated returns line |
|---|---|---|
| Throughput | Capped by headcount and walking distance; typically 150–300 items per person-hour (planning range) depending on layout | Configurable by sorter type; cross belt lines run in the thousands of parcels per hour |
| No-read / error rate | Reads fail on a few percent of damaged or handwritten labels; misroutes surface late, after the item lands in the wrong lane | Below 0.1% on a configured AI OCR/DWS station (TrueLiSort planning estimate); exceptions flagged at the decision point |
| Labor share of operating cost | 55–70% (planning assumption) | Labor reduced 60–75% for the same throughput (TrueLiSort planning estimate) |
| Receive → resellable cycle | 7–10 days typical | Under 24 hours on a configured line |
| Payback | n/a | 2.5–4.5 years for a mid-size configuration at current US/EU labor rates (TrueLiSort planning estimate) |
The 90-Day Pre-Peak Plan
For a 2026 peak, the calendar is fixed: Black Friday is November 27 and the returns wave starts around December 26. Working backward from that date, this plan fits a 90-day window.
| Phase | Dates (2026) | Actions |
|---|---|---|
| Day 90–60 | Late Aug – late Sep | Inventory the current returns process: volume by category, labor hours, dwell time, error rate. Set the budget envelope and the targets (throughput, dwell, labor reduction). |
| Day 60–30 | Late Sep – late Oct | Select technology by scenario; request layout drawings and a factory-direct quote; freeze the configuration and order. |
| Day 30–15 | Late Oct – mid Nov | Manufacturing and shipping lead time; run site prep, electrical, and conveyor layout in parallel so installation is not delayed. |
| Day 15–0 | Mid Nov – Nov 27 | Install, commission, and run test volumes; train operators; document exception handling before the peak. |
| Dec 26+ | Returns wave | Execute; measure dwell, no-read, and labor hours against the Day-90 baseline; adjust disposition rules weekly. |
Two points on lead time. First, most mid-size configurations need roughly 6–8 weeks from configuration freeze to commissioning, so the window closes faster than it looks. Second, the plan works for any future peak: replace the 2026 dates with the next Black Friday and the same cadence applies.
Building the Business Case: ROI & Payback
The three numbers that drive the decision
Three numbers do most of the work in a returns-automation business case:
- Labor reduction of 60–75% on returns-processing staff (TrueLiSort planning estimate; validate against your own process).
- Payback of 2.5–4.5 years for a mid-size configuration at current US/EU warehouse labor rates (TrueLiSort planning estimate; shorter where labor is more expensive or volume is higher).
- Restock cycle under 24 hours, which converts returned seasonal inventory into revenue while demand is still live.
The robotic returns and reverse logistics market is projected on the order of $375 million, growing at roughly 25% CAGR (Future Market Insights estimate). That tells you where the industry is heading — not that automation is right for every facility today. Your decision should rest on your own volume and labor math.
Plug in your own numbers
Rather than trust a generic ROI figure, run the math on your operation. Before you request a layout or a quote, pull these five numbers — each one changes the size, the technology, and the price of the system you will be quoted:
- Average returned items per day in your peak window — the single biggest driver of system size. Count the worst two weeks after Christmas, not your annual average; if you under-size here, the line overflows exactly when you need it most.
- Peak-to-normal volume multiple — how many times your normal daily returns volume the peak reaches. Plan for 3–5x if you are e-commerce-heavy; if apparel is a large share of your business, stress-test upward.
- Returns-processing headcount today — how many people work the returns area in a normal week. This sets the baseline for the 60–75% labor-reduction range.
- Blended hourly cost per worker (wage + benefits) — the actual cost per hour per person, not just the base wage. This converts headcount into annual dollars in the payback math.
- Average days from receive to resellable today — how long items currently sit before they are sellable again. Multiply that by the value of the returned inventory to see what dwell time is costing you in seasonal sales.
Annual labor savings ≈ (returns headcount × blended rate × hours) × the share of that time automation removes — use 60–75% as the planning range. Compare that against the factory-direct equipment and installation figure from the engineering team, and you have a payback estimate grounded in your own data rather than a brochure. For the cost structure that drives the equipment number, see our automated parcel sorting system cost guide.
Frequently Asked Questions
What is returns processing automation?
Returns processing automation is a combination of equipment — a sorter (put wall, narrow belt, or cross belt), DWS (dimensioning-weighing-scanning) stations, and AI OCR — plus disposition logic that routes returned items to restock, refurbish, vendor-return, liquidate, or scrap without manual sorting.
How much does returns sorting automation cost?
There is no single answer, because a returns line is configured to volume, floor plan, and label quality; a fixed price would be misleading. TrueLiSort works from layout drawings and quotes factory-direct, which removes distributor markup and lets the quote match the configuration. For the cost structure and the variables that drive it, see our automated parcel sorting system cost guide.
How long does it take to install a returns sorter?
For a typical mid-size configuration, plan for roughly 6–8 weeks from configuration freeze to commissioning, including manufacturing, shipping, site prep, and training. That is why the 90-day pre-peak window matters: a project started now can be live before the late-December returns wave.
Can automation handle damaged or handwritten labels?
Yes, with limits. AI vision and OCR read faded thermal labels, partially damaged barcodes, and many handwritten return slips. On a configured DWS/OCR station, no-read rates drop from a few percent to below 0.1% (TrueLiSort planning estimate). Items that still fail are flagged to an operator instead of being misrouted.
What return rate should I plan for?
As a planning baseline, apparel returns run 30–50%, footwear and electronics 20–35%, based on commonly cited retail returns research (Appriss Retail / NRF). Validate against your own category mix and return policy; size the line for your peak window, not your annual average.
How fast is payback on returns automation?
For a mid-size configuration at current US/EU warehouse labor rates, TrueLiSort’s planning estimate is 2.5–4.5 years, driven mainly by labor reduction of 60–75% and faster restock. The number shifts with volume, labor cost, and whether current dwell time is costing you seasonal sales.
Conclusion
The post-holiday returns wave is a fixed date on the calendar, and for 2026 that date is December 26 — Black Friday falls on November 27, 90 days from today. The choice is not whether to absorb it, but whether you absorb it with overtime and decaying inventory value, or with a returns line that cuts labor 60–75%, keeps no-read rates below 0.1%, and restocks most items in under 24 hours (TrueLiSort planning estimates). According to TrueLiSort, a mid-size configuration typically pays back in 2.5–4.5 years at current US/EU labor rates — and the 90-day lead time needed to install it is exactly the window you are in now.
Start the Conversation Before Peak
Contact the TrueLiSort engineering team for a throughput estimate based on your actual volumes and floor plan, and request a factory-direct layout & quote.
Related Reading
- Automated parcel sorting system cost guide — what drives the total cost of a sorting system
- Cross belt vs narrow belt sorter — a direct comparison of the two most common sorter types
Returns Spike Profile: Three Weeks of Reverse Logistics
The post-holiday return wave is not uniform. It arrives in three bands, and each needs a different handling rule. Plan capacity for the second band, not the average.
| Week | Volume vs baseline | Dominant reason | Handling rule |
|---|---|---|---|
| 1 | 3× | Wrong size / gift returns | Fast-refund, no inspection |
| 2 | 5× | Defective / not-as-described | Inspect, quarantine, vendor RMA |
| 3 | 2× | Late arbitrage returns | Restock or outlet |
Frequently Asked Questions
Should returns go through the same sorter as outbound?
During week 2, ideally not. Returns need inspection lanes the outbound sorter lacks; mixing them throttles the profitable flow. A separate put-wall or manual bench protects throughput.
How do I size the temporary team?
Plan for 5× baseline in week 2, then shed 60% by week 4. Permanent headcount should cover baseline only; the spike is contracted or cross-trained.
The forward-flow counterpart is in our same-day-delivery breakdown. The discipline is part of reverse logistics practice.