

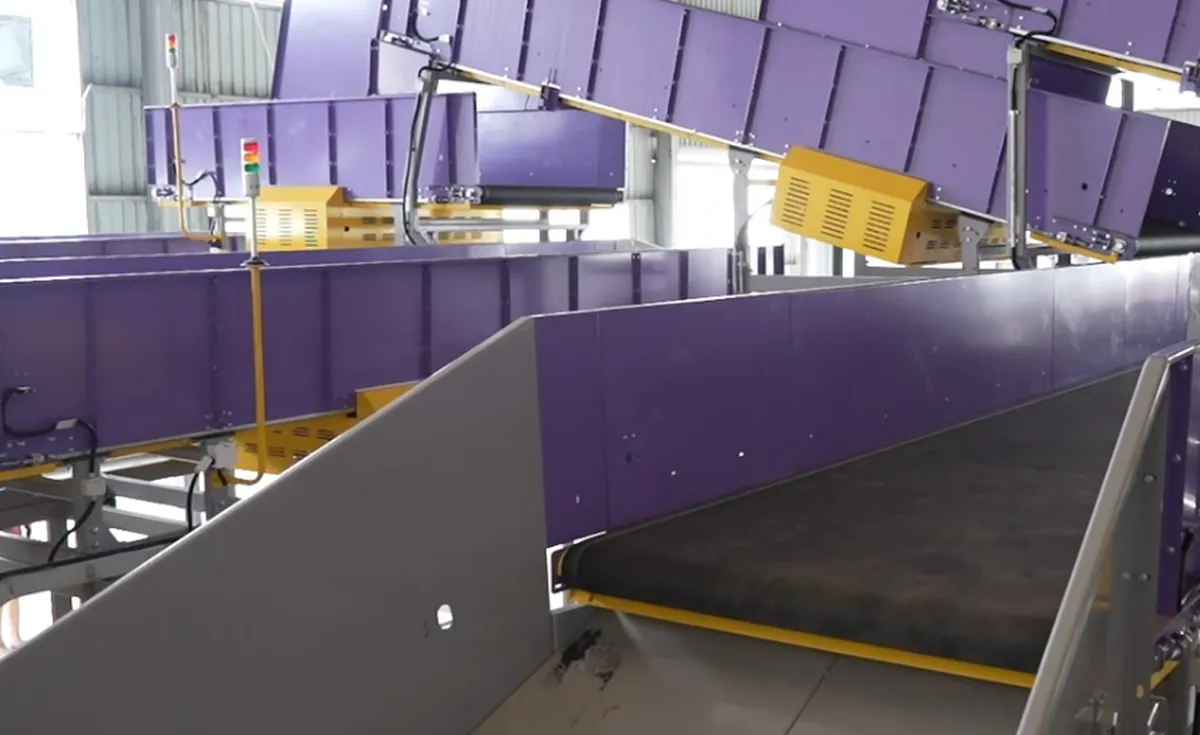
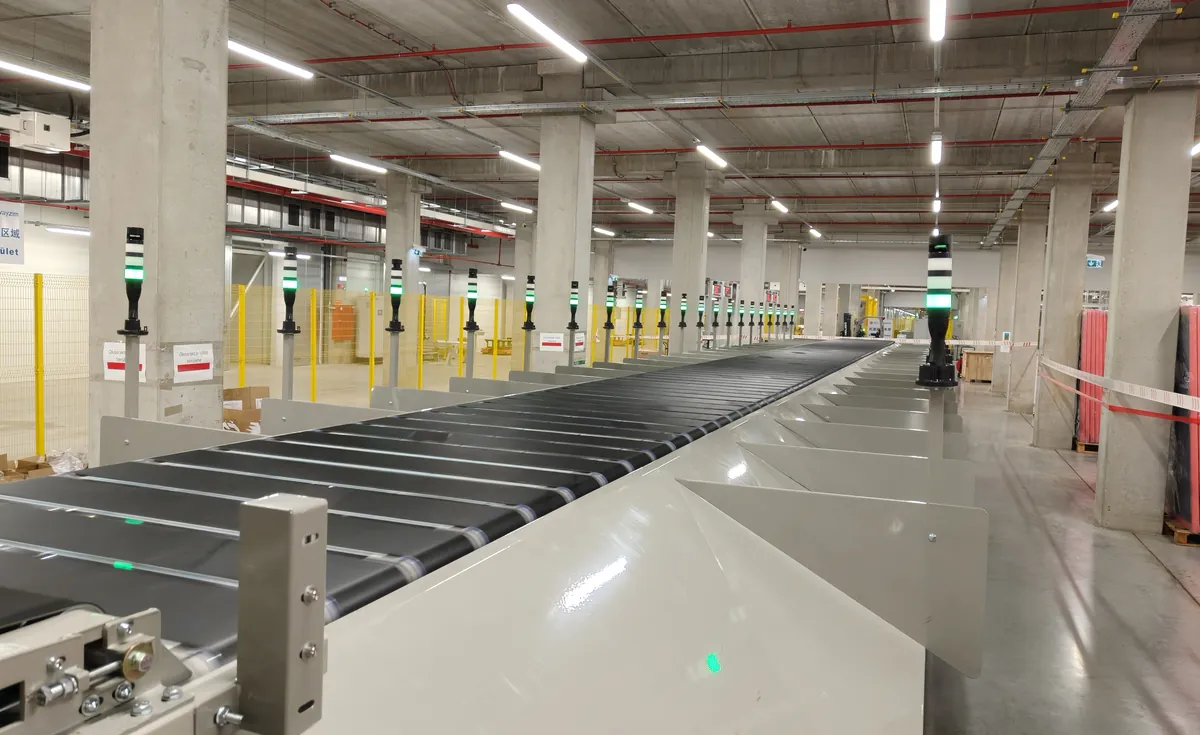
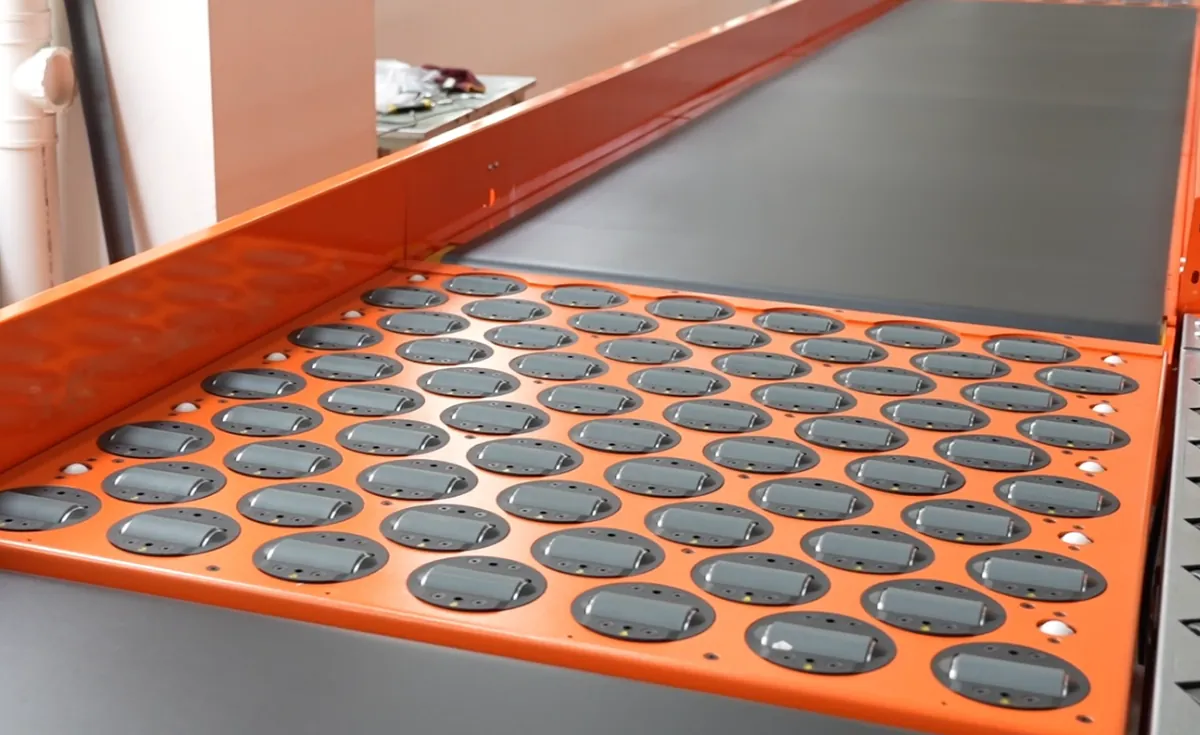
As e-commerce and express delivery services continue to surge, traditional manual sorting methods are struggling to keep up with the volume and complexity of modern logistics operations. Automated sorting systems are quickly becoming the key to improving efficiency, reducing errors, and cutting operational costs.
Equipped with technologies such as six-sided scanning, dynamic weighing, automatic barcode recognition, and intelligent route allocation, these systems are integrated with Warehouse Management Systems (WMS) and Transport Management Systems (TMS) to enable full traceability across the supply chain. Mainstream solutions include diverter wheel sorters, cross-belt sorters, DWS systems, and spiral chutes, widely used in e-commerce warehouses, express hubs, and 3PL centers.
Looking ahead, the integration of AI and IoT will push sorting solutions toward a new era of fully unmanned, data-driven logistics operations, helping companies build more flexible and responsive supply chains.
Efficiency, Quantified: The Numbers That Move
“Revolutionising efficiency” is testable. Four numbers move when sorting is automated, and each has a defined manual baseline worth measuring before you invest:
| Metric | Typical manual line | Typical automated line |
|---|---|---|
| Parcels per labour hour | 60–120, fatigue-limited | 400–800, machine-limited |
| First-pass sort accuracy | 97–99%, drifts with shift length | 99.9%+, stable and logged |
| Cost per parcel (labour portion) | Rises every wage cycle | Falls with volume amortisation |
| Peak-day departure completeness | Misses under surge pressure | Held at nameplate rate |
One discipline keeps these numbers honest: measure your own manual baseline under your own parcel mix before quoting any automated alternative. Industry averages hide the very variation that determines payback — a facility with 40% irregular parcels faces a different equation than one handling uniform polybags, whatever the brochure says. The four numbers also interact: accuracy gains quietly fund themselves through eliminated re-handling, and departure completeness converts directly into carrier penalty avoidance. The warehouse flows that feed these metrics are mapped in five warehouse flows, one backbone, and the e-commerce order profiles behind them in four order profiles, four problems. Reference: overall equipment effectiveness and throughput.
Baseline Measurement: A One-Week Protocol
The four efficiency numbers are only as persuasive as the baseline underneath, and a one-week protocol produces one that survives scrutiny. Day one and two: count parcels per labour hour by shift, not by day — the shift split is where fatigue and staffing quality hide. Day three: sample accuracy by re-checking one destination’s output against its manifest, timed, so the re-handling cost is captured alongside the error rate. Day four: price the labour portion per parcel from actual payroll allocation, including agency premiums and overtime loadings that finance often books elsewhere. Day five: rehearse the peak question — what departed late on the last promotional day, and what did the carrier penalty or the apology cost? Five days of honest counting produces a baseline that no vendor can dismiss and no board can ignore. It also produces the facility’s first quality instrument: after go-live, the same protocol measures the step-change with the same ruler, which is what a payback case ultimately stands on.
Priced In, Not Promised
The value described here becomes real only when it is measured: throughput per shift, accuracy per thousand, labour hours reallocated, promises kept per wave. Operations that instrument all four registers convert the claims in this article into a baseline their next vendor must beat — the measurement frame lives in the value measurement frame.