

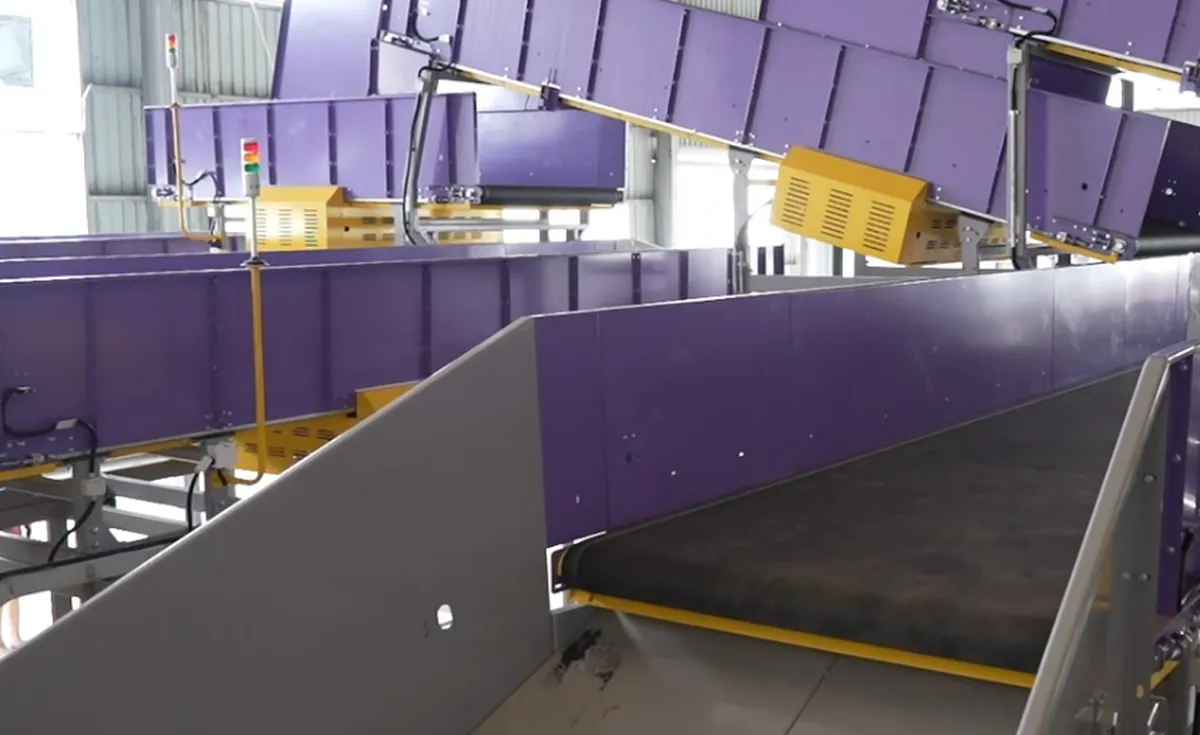
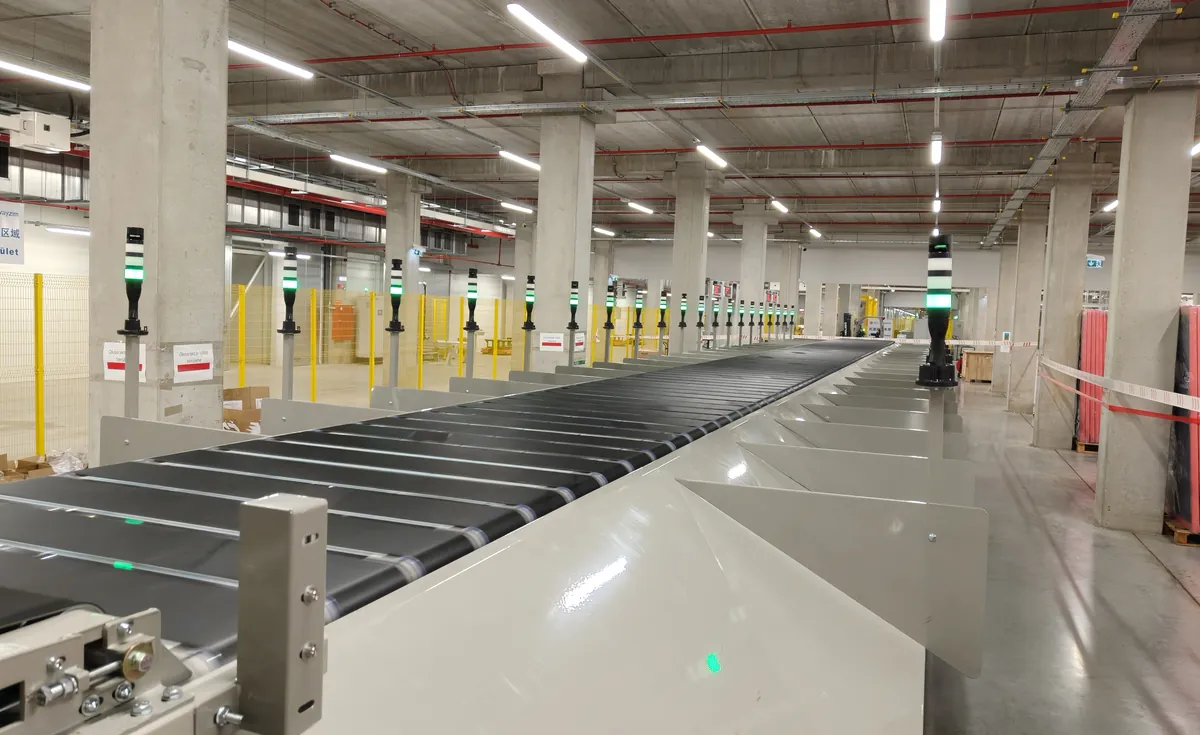
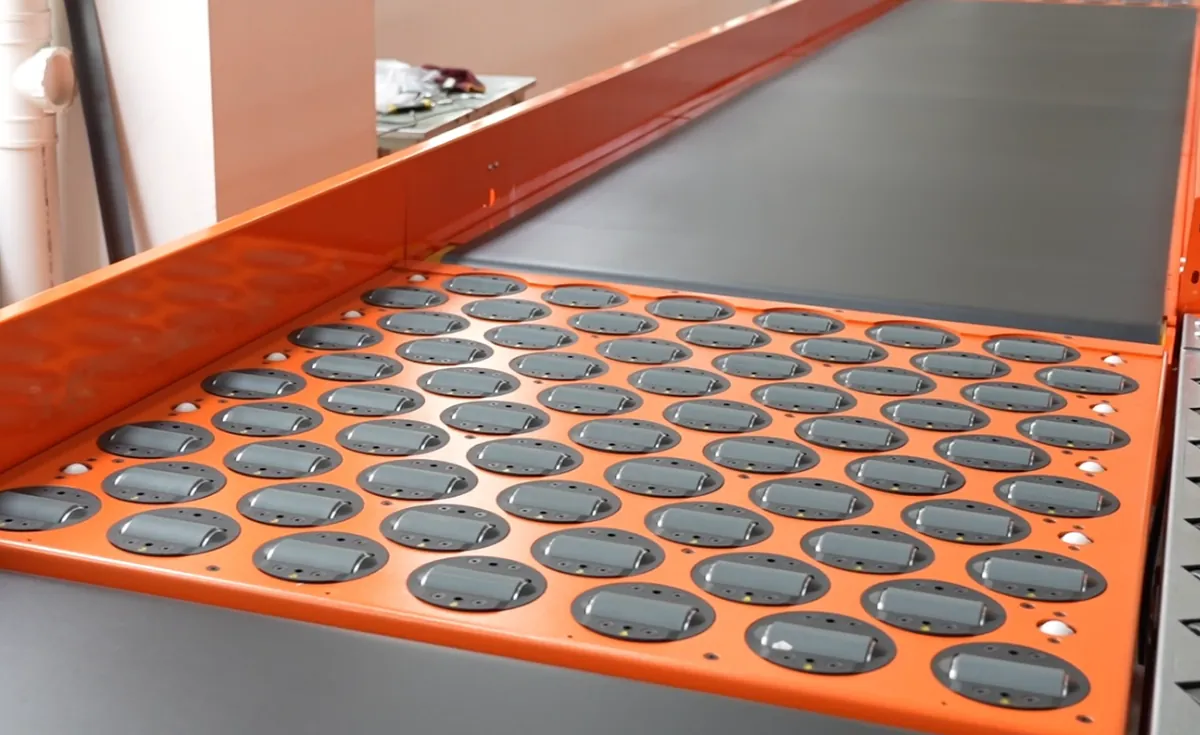
In today’s fast-moving logistics industry, the demand for automation and intelligent solutions continues to rise. E-commerce growth and the need for rapid order fulfillment have pushed warehouses and distribution centers to seek smarter, faster, and more flexible sorting systems.
Modern **automated sorting technology**, such as *wheel sorters, cross-belt sorters,* and *DWS (Dimensioning, Weighing, Scanning) systems*, are transforming the way goods are handled. These solutions not only increase sorting accuracy but also reduce manual labor costs and improve operational safety.
At the core of this transformation is the integration of **AI vision systems** and **real-time data management**. Intelligent algorithms can identify, measure, and track each parcel instantly, ensuring smooth flow throughout the logistics chain. This level of automation enables companies to handle thousands of parcels per hour while maintaining high accuracy and traceability.
As global supply chains evolve, customized sorting solutions—tailored to each warehouse’s layout, throughput, and product type—will become essential. The future of logistics lies in *smart, connected, and sustainable sorting systems* that empower businesses to deliver faster, greener, and more reliably than ever before.
Efficiency’s Second Derivative: What Smart Sorting Really Accelerates
Smart sorting is usually sold on rate — the first derivative of throughput. Its deeper effect is on the second derivative: how fast the operation improves. Where the acceleration lives:
| Improvement loop | Manual operation | Smart-sorted operation |
|---|---|---|
| Spot a pattern | Anecdote; someone noticed something | Telemetry flags the anomaly itself |
| Diagnose it | Walk the floor, interview shifts | Replay the parcels, timestamps and diverts |
| Fix it | Brief the team, hope it holds | Update the rule; the fix is a config line |
| Verify it held | Trust and occasional audits | Trend line answers in a week |
The compression in that table is the real product. A manual operation might improve a process quarterly, because each improvement costs days of investigation; a smart-sorted operation runs the same loop weekly because the loop itself got cheaper. Compounding does the rest — fifty small fixes a year, most invisible individually, accumulate into the gap that appears between peer facilities running similar hardware on similar volume. This is also why “smart” features resist specification-sheet comparison: their value is not a feature but a velocity, and velocity only shows in the trend data a reference site can show you. When evaluating vendors, ask for exactly that — eighteen months of a customer’s error-rate trend, not their month-one acceptance report. The data rungs enabling this are in the data ladder, and the learning organisation behind it in shift-by-shift transformation. Reference: continuous improvement and operational efficiency.
Acceleration, not level, is the number worth watching weekly. A stable operation improving half a percent per week compounds past a flashier neighbour who improves two percent for one month and flatlines; the moving average of improvement rates, kept on one chart, makes the difference visible before annual reviews would. Reference: moving averages and trend extrapolation.
The Global Lens
Read against the global landscape, this piece gains a second layer: the same automation logic is being adopted at three different speeds across regions, and the constraints that shape a European retrofit differ from a greenfield build. The regional adoption speeds puts those speeds side by side, and the direction they all point is the same one this article traces.